by Daniel King
Each month we will include a short column highlighting a specific practice or technique related to quail management. We have compiled a list of relevant topics to discuss but welcome your input and suggestions. If you have a topic you would like addressed, e-mail your suggestion to daniel.king@quailresearch.org.)
Last month we talked about the 3 needs a quail has that the habitat should fulfill: 1. Food, 2. Escape and loafing cover, and 3. Nesting cover. Today we’ll look at the parameters within which we like to see those needs met and discuss evaluating your habitat.
Use the Bobwhite Habitat Evaluation App that we use and recommend, (https://apps.apple.com/us/app/northern-bobwhite-habitat-evaluation/id903595892); it’s pretty user-friendly, but if you have problems don’t hesitate to contact me for assistance.
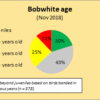
The evaluation begins with nesting cover as it is often the weak link. The target here is a minimum of 300 suitable bunchgrasses (basketball size, 12” tall) per acre or about 40-80 prickly pear (3’ diameter) clumps per acre. Rather than attempt to actually count all 300, we equate this number to a percentage of the one-acre area being evaluated. To evaluate, you will walk 100 large paces in a straight line while recording each time your foot lands on a suitable nesting clump. The number of times that happens represents an approximation of the percentage of the area that provides suitable nesting cover. We deem anything over 60% as excellent, between 40% and 60% is good, between 20% and 40% is fair, and anything under 20% is poor.
Next, we look at escape and loafing cover. In general, we want a high diversity (>5 species) of large (>10 ft canopy diameter) woody plants interspersed so that you can easily throw a softball from one to the next. To quantify this, we are looking for canopy cover of 20-30% as excellent, between 10-20% or 30-40% as fair, and anything over 40% or under 10% as poor (the app allows a little more slack on these numbers). You can estimate this just as you did the nesting cover; counting steps that would fall under brush cover rather than nesting cover. Obviously, you will not actually be able to walk straight through the brush, but count the steps as if you had. A reminder that we are looking for suitable cover here, the single-stem mesquite trees and shoebox-sized shrubs do not count.
Finally, we want to see at least 5 food-producing plant species distributed across the habitat. A list of plants and instructions for the full survey are included in the app, but the basic technique is as follows: again, you will walk a 100-pace line across the habitat. Each 10th step you will stop to assess the abundance and variety of food plants; counting the number of species present at that spot and the area you had to search to find those plants. If you find 5 or more food plant species within a 4 square yard area at each stop (or on average), I would deem it excellent. If it takes 4-8 square yards to find them, it gets a ranking of “good”; 8-16 square yards would be fair; and anything over 16 would be “poor.”
Repeat this evaluation (or at least its principles) at multiple locations across the landscape to develop a picture of the habitat quality at the desired scale.
Relevant webisodes: